Aspects of Slavery and Freedom Seeking in North Carolina
Mapping Crop and Manufacturing Production
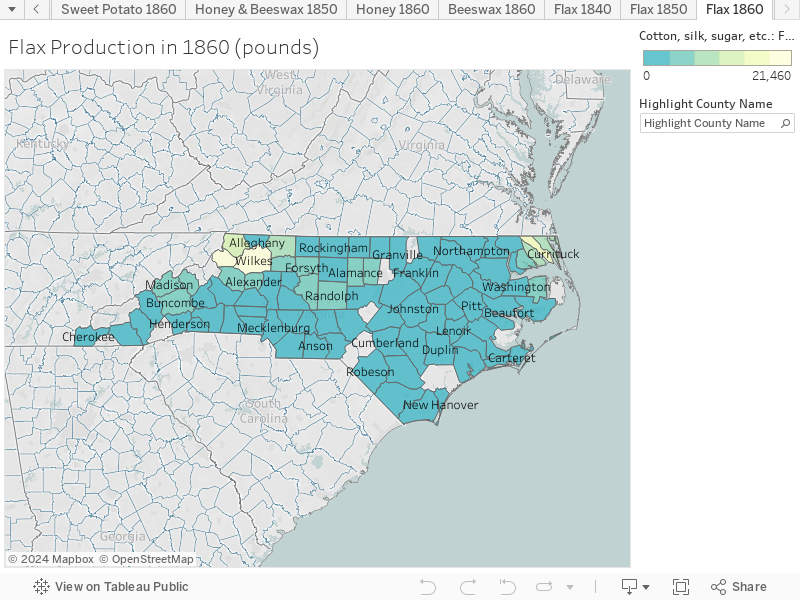
The following maps are maps of significant crop and industry productions in North Carolina in the mid to late antebellum [before the Civil War] period. We can learn from these maps about North Carolina primary production, the concentration of labor [in many instances slave labor], and the location of these productions.
North Carolina's economy changes over time, and this affects the amount of production and geographical concentrations. These maps, too, teach about enslaved people. These maps will help show why and where enslaved people labored; why certain products became profitable and when other became less profitable- this may help reveal, in some cases, why enslaved people were sold.
These maps may also help underscore the type of and the variety of labor they may have been doing. These maps also denote, albeit not visible, general development, population increase, transportation, and communication innovations, such as railroads and canals.
How-To-Pan
- Place the mouse over the map until the map vertical menu appears on the left.
- Click the right-facing arrow under the home button and then click the directional cross.
- Or, Hold the (F) key